Cacti is a free and open source front-end network monitoring tool used to monitor and graph time-series metrics of various IT resources in your LAN. It uses the RRDtool to poll services at specified intervals and thereafter represent them on intuitive graphs.
Cacti monitors various metrics such as CPU, memory and bandwidth utilization, disk space, filesystems and running processes to mention a few. You can monitor devices such as servers, routers, switches and even firewalls. Additionally, you can configure alerts such that in case of system downtime, you can receive notifications on email. In this guide, we will walk you through the installation of the Cacti monitoring tool on CentOS 8 / RHEL 8. At the time of penning down this tutorial, the latest Cacti version is version 1.2.14.
Step 1) Install Apache web server
Cacti is a web-based graphing tool, and therefore, we need to install a web server on which the monitoring tool will run on. Here, we are going to install the Apache web server. To do so, execute the command:
$ sudo dnf install httpd -y
Step 2 ) Install PHP and additional PHP extensions
The front-end of the Cacti monitoring tool is purely PHP driven and with that, we need to install PHP and the required PHP modules. Therefore, execute the command:
$ sudo dnf install -y php php-xml php-session php-sockets php-ldap php-gd php-json php-mysqlnd php-gmp php-mbstring php-posix php-snmp php-intl
Step 3) Install MariaDB database server
During installation, Cacti requires its own database to store its files. Additionally, it needs a database for storing all the required data that is needed in populating graphs.
MariaDB is a fork and a drop-in replacement for MySQL. It’s considered more robust and feature-rich and while MySQL would still work, MariaDB comes highly recommended. To install the MariaDB server, run the command:
$ sudo dnf install -y mariadb-server mariadb
Step 4) Install SNMP and RRD tool
Next, we are going to install SNMP and RRDtool which are essential in gathering and processing system metrics.
$ sudo dnf install -y net-snmp net-snmp-utils net-snmp-libs rrdtool
Step 5) Start and enable services
Having installed all the necessary services required for Cacti to run, we are going to start them as shown:
$ sudo systemctl start httpd
$ sudo systemctl start snmpd
$ sudo systemctl start mariadb
Additionally, ensure to enable them on boot, such that they automatically start upon booting or a reboot.
$ sudo systemctl enable httpd
$ sudo systemctl enable snmpd
$ sudo systemctl enable mariadb
Step 6) Create a database for Cacti
In this step, we are going to create a database and user for cacti and later grant all privileges to the cacti user. Run the following commands:
CREATE DATABASE cactidb;
GRANT ALL ON cactidb.* TO cacti_user@localhost IDENTIFIED  BY ‘cactipassword’;
FLUSH PRIVILEGES;
EXIT;
Be sure to note down the database name, user and password as these will be required later on in the installation process.
Next, we need to import the mysql_test_data_timezone.sql to mysql database as shown.
$ mysql -u root -p mysql < /usr/share/mariadb/mysql_test_data_timezone.sql
Then log in to mysql database and grant the cacti user access to the mysql.time_zone_name table.
GRANT SELECT ON mysql.time_zone_name TO cacti_user@localhost;
FLUSH PRIVILEGES;
EXIT;
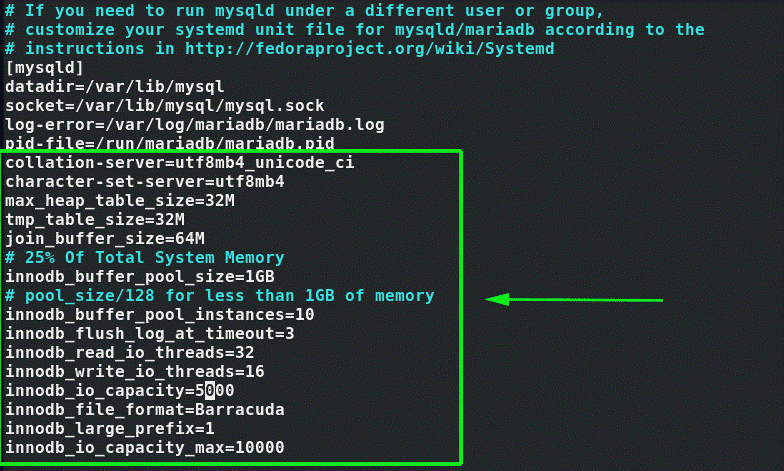
Some database tuning is recommended for optimum performance. Append the following lines in the mariadb-server.cnf file under the [ mysqld ] section as shown.
$ sudo vi /etc/my.cnf.d/mariadb-server.cnf
............
collation-server=utf8mb4_unicode_ci
character-set-server=utf8mb4
max_heap_table_size=32M
tmp_table_size=32M
join_buffer_size=64M
# 25% Of Total System Memory
innodb_buffer_pool_size=1GB
# pool_size/128 for less than 1GB of memory
innodb_buffer_pool_instances=10
innodb_flush_log_at_timeout=3
innodb_read_io_threads=32
innodb_write_io_threads=16
innodb_io_capacity=5000
innodb_file_format=Barracuda
innodb_large_prefix=1
innodb_io_capacity_max=10000
..............
Save and exit the configuration file
Step 7) Installing and configuring Cacti monitoring tool
With the database in place and all the other prerequisites having been fulfilled, let’s now install Cacti.
Cacti package is not available in default CentOS 8 / RHEL 8 repositories, it is available in EPEL repository. So run below command to enable epel repo
$ sudo dnf install epel-release -y
To install Cacti monitoring tool, run the command:
$ sudo dnf install cacti -y
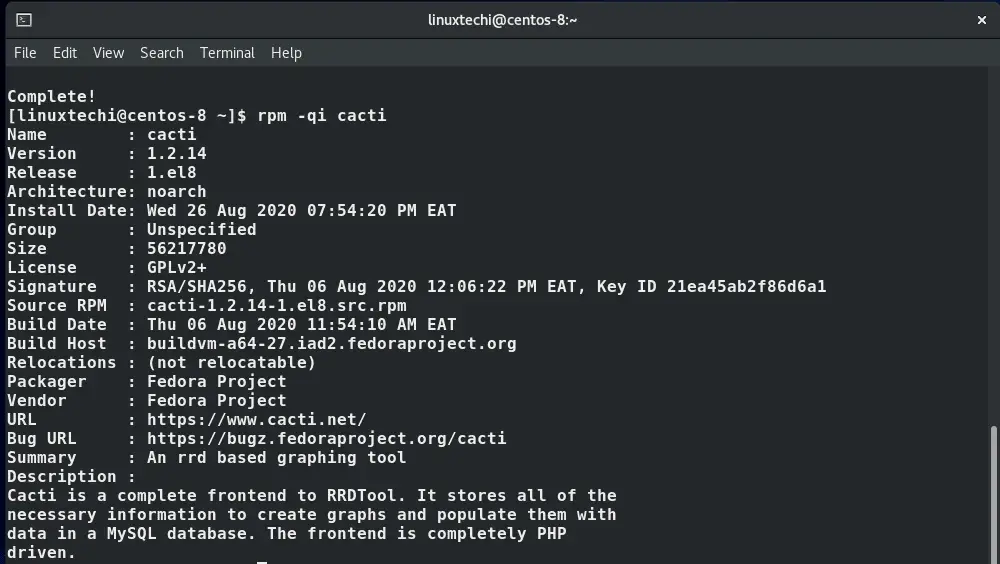
After the installation, you can confirm the installation of cacti by running the command:
$ rpm -qi cacti
You should get a detailed output showing the version, release, size and Vendor to mention a few of the Cacti package.
Next, import the default cacti database tables to the cacti database that was created earlier in step 6. To find out the path of the default database, run:
$ rpm -ql cacti | grep cacti.sql
Once you get the path, import the default database using the command:
$ mysql -u root -p cactidb < /usr/share/doc/cacti/cacti.sql
Next, edit the cacti configuration file and specify the database details as shown:
$ sudo vim /usr/share/cacti/include/config.php
Set the database name, username and password and leave the rest of the options as they are.
Save the changes and exit the configuration file. Thereafter, set the timezone by editing the php.ini file as shown.
$ sudo vim /etc/php.ini
.................................
date.timezone = Asia/Dubai
memory_limit = 512M
max_execution_style = 60
.................................
Save and exit the file.
Next, edit the cron entry as shown
$ sudo vim /etc/cron.d/cacti
Uncomment this line to ensure the Cacti polls data every 5 minutes and save the configuration
*/5 * * * * apache /usr/bin/php /usr/share/cacti/poller.php > /dev/null 2>&1
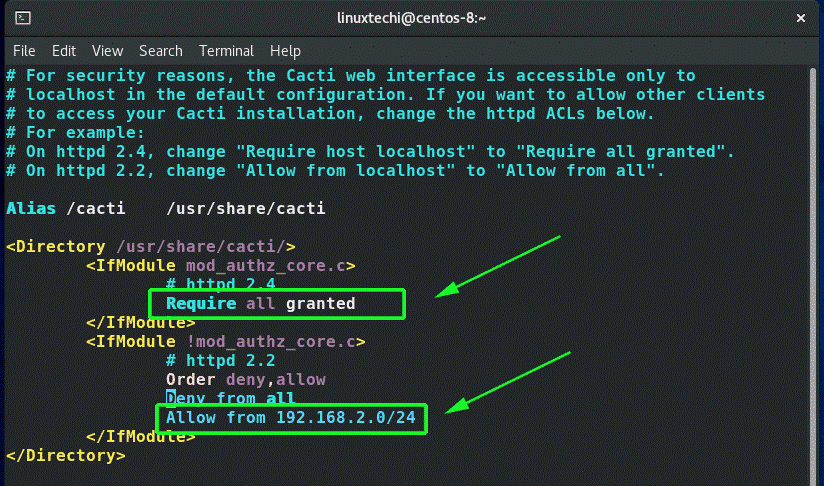
Next, modify Apache’s configuration file to enable remote installation of Cacti.
$ sudo vim /etc/httpd/conf.d/cacti.conf
Modify the following httpd ACLs to grant access to remote users
Change Require host localhost to Require all granted
Modify Allow from localhost to Allow from [network subnet]
For the network subnet, be sure to specify your own network subnet. For our case, the subnet is 192.168.2.0/24
For all the changes made to come into effect, execute:
$ sudo systemctl restart httpd
$ sudo systemctl restart php-fpm
Step 8) Configure firewall rules for Cacti
Before finally setting up Cacti, allow HTTP service on your firewall as shown:
$ sudo firewall-cmd --permanent --add-service=http
$ sudo firewall-cmd --reload
Step 9) Set up Cacti via the browser
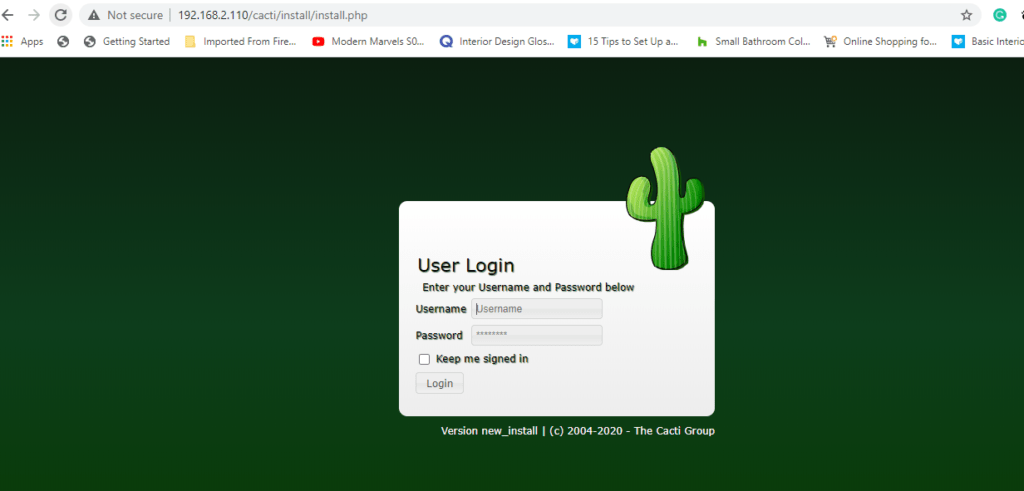
To finish setting up Cacti, visit your server’s IP as shown
http://server-ip/cacti
You will get the page displayed as shown. Log in using the credentials shown
Username: admin
Password: admin
Click ‘Login’ to proceed.
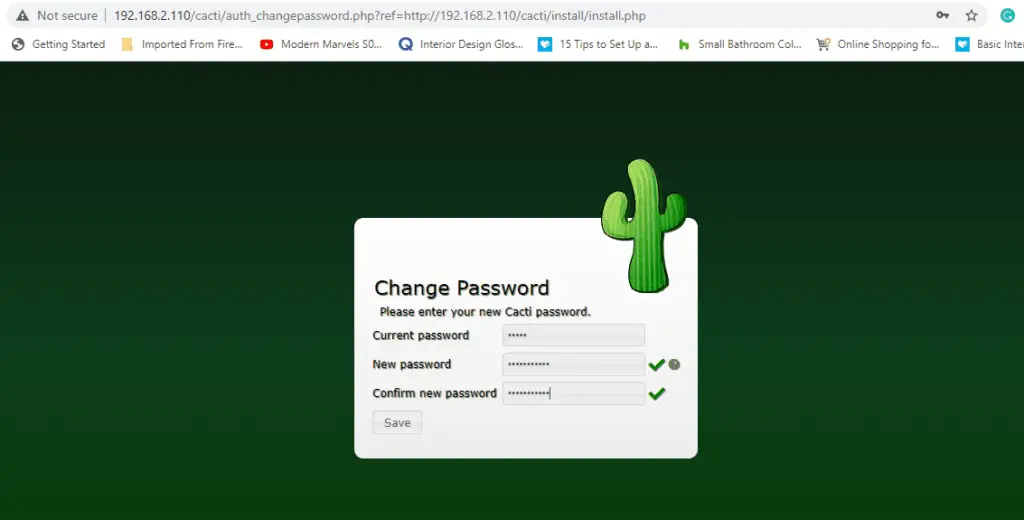
Next, you will be required to change the default login password by providing a password of your own. Be sure that you provide a strong password (with a combination of uppercase, lowercase, numeric and special characters). Then click ‘Save’.
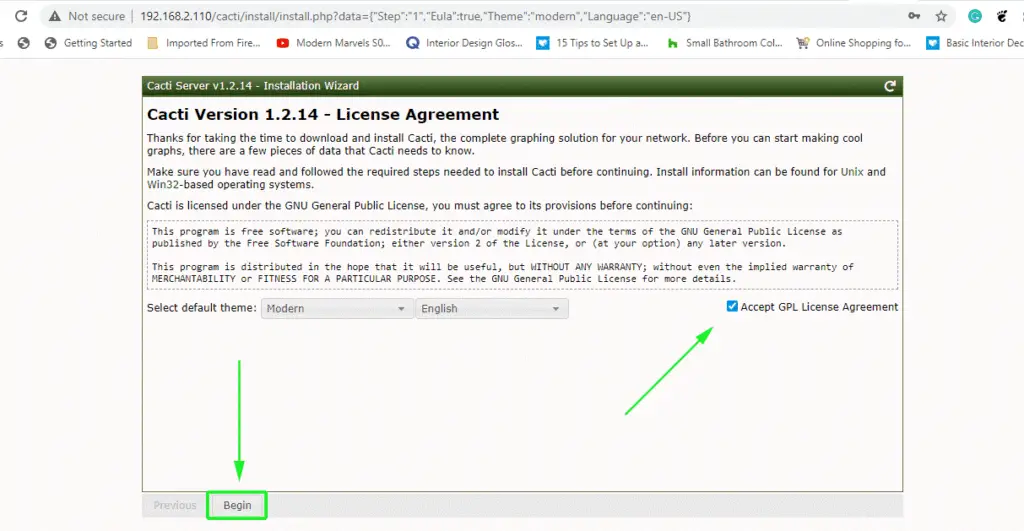
In the next step, check off the ‘Accept GPL license agreement’ checkbox and click on ‘Begin’.
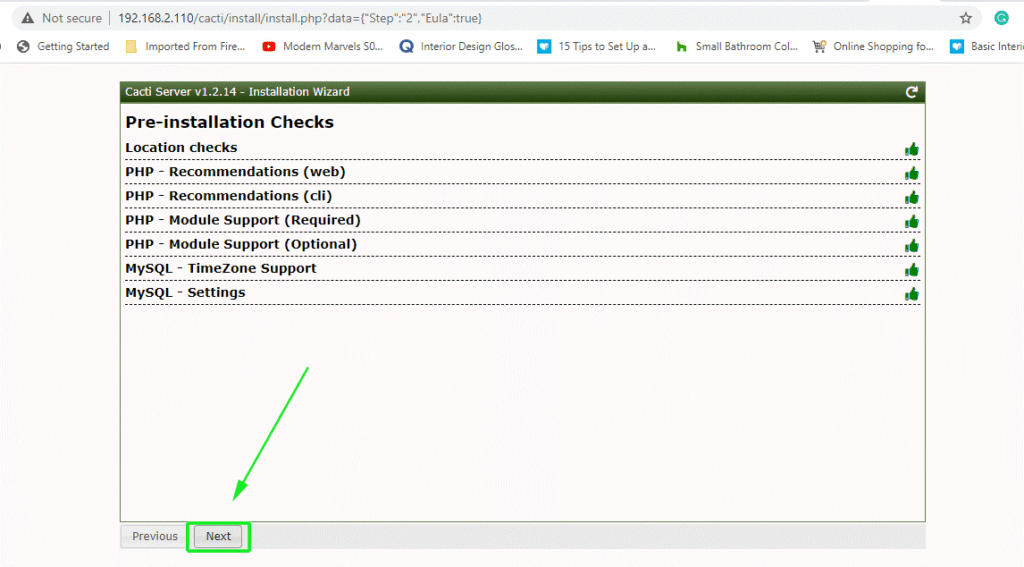
Cacti will perform pre-installation checks, confirming if the required PHP modules are installed and the correct database settings have been configured. If everything looks good, click on ‘Next’. If something’s amiss, click on the ‘Previous’ button and go back to the configuration file and add what’s missing.
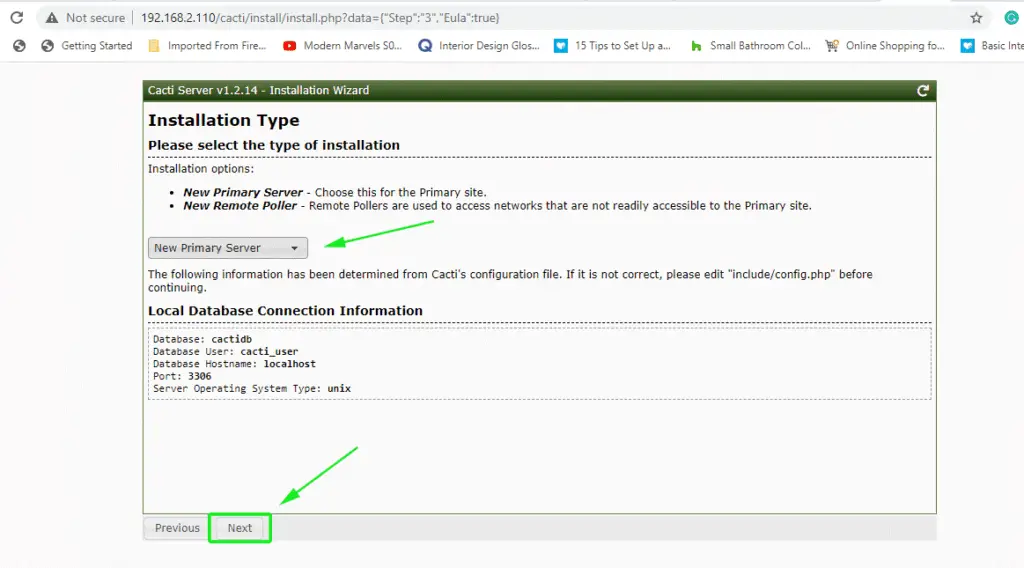
Thereafter, select the ‘New Primary Server’ option for installation and also ensure that the database connection details are correct before proceeding.
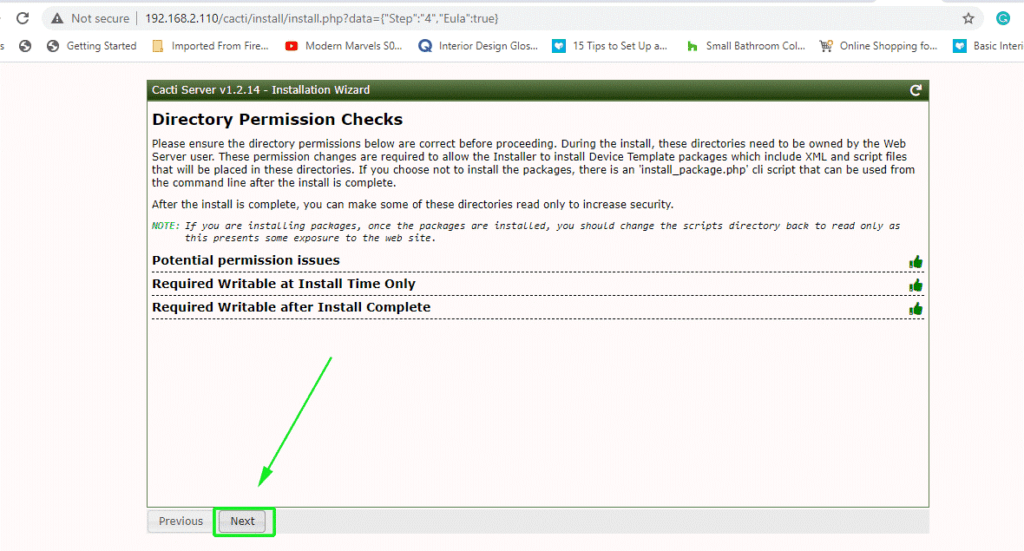
The next step probes for any directory issues and ensures that the correct permissions are in place. If all is good, click ‘Next’, otherwise click ‘Previous’ and rectify any issues.
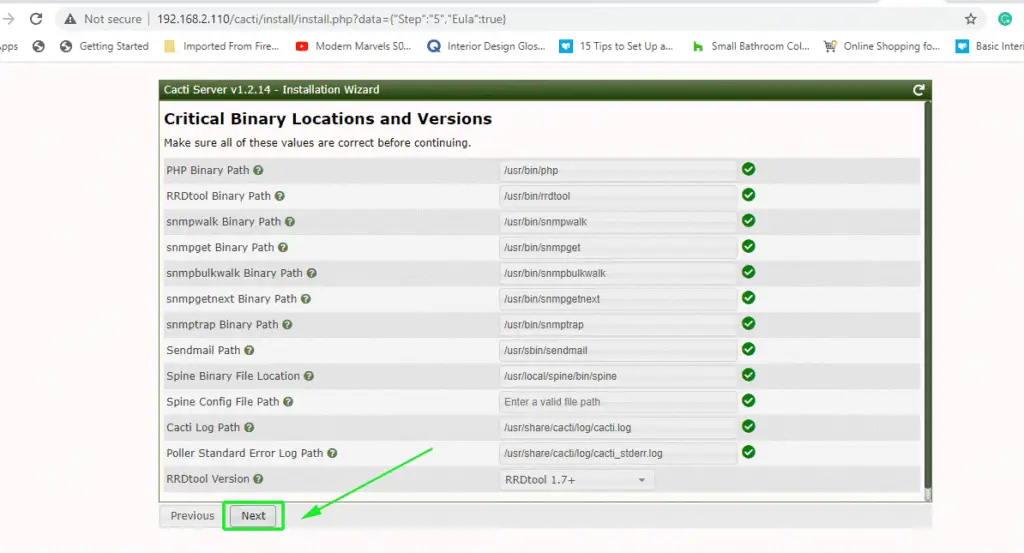
Next, the installer checks to see if all the binary paths of the necessary packages are installed.
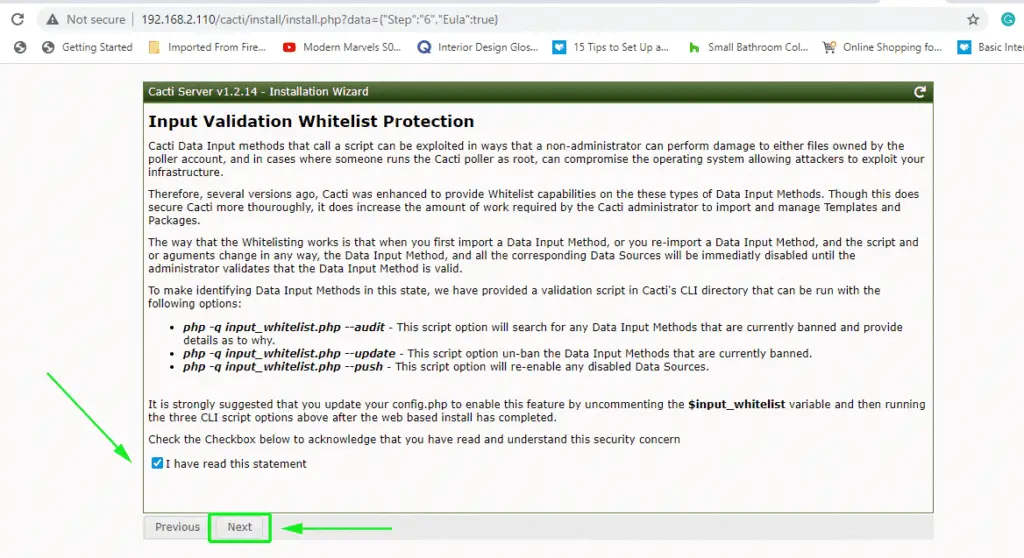
The latest version of Cacti has introduced another crucial step and that is the validation of data input methods. This gives you a few steps to follow after the installation of cacti to whitelist data input methods. Read through the instructions carefully and check the ‘I have read this statement’ button.
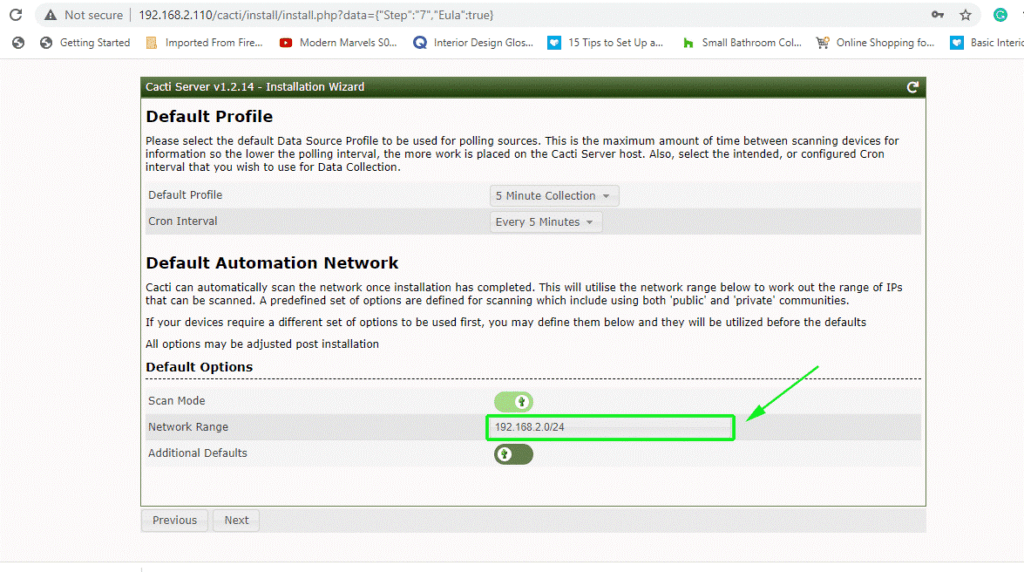
In the next step, select the cron interval for scanning devices and define your network subnet as shown. Then click ‘Next’.
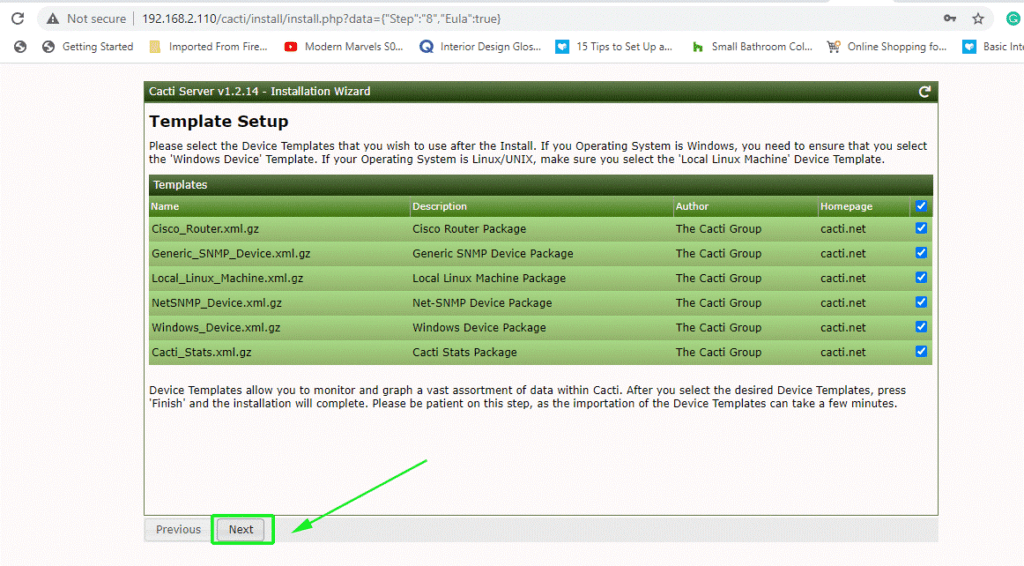
Cacti ships with templates that give you the ability to monitor and graph an assortment of devices in your network including Cisco devices (routers and switches), Linux and Windows machines. By default, all options are checked to include all the templates that you would require. If you are happy with that, simply click ‘Next’.
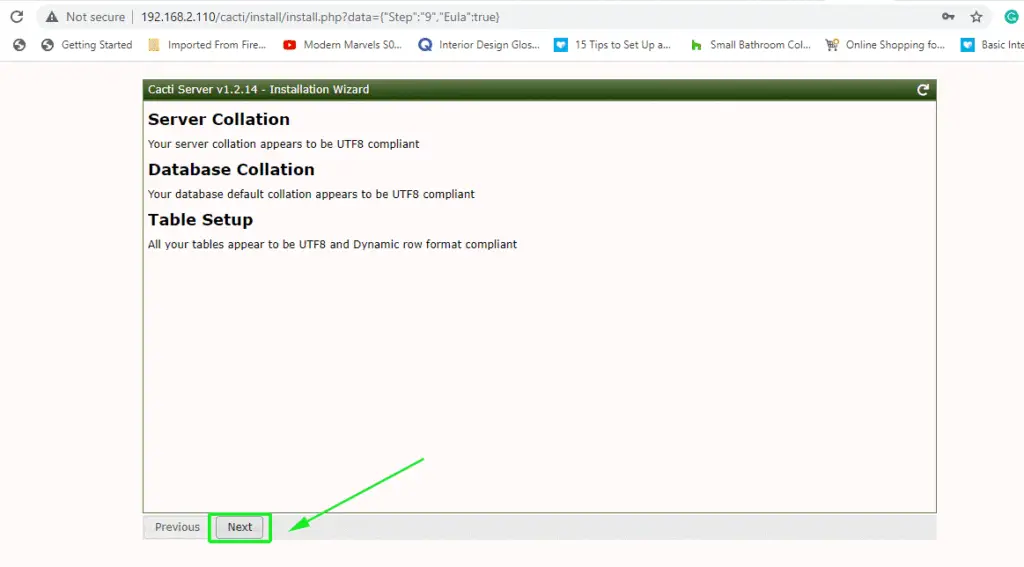
Thereafter, the installer will check if the database collation is UTF8 compliant. Click ‘Next’.
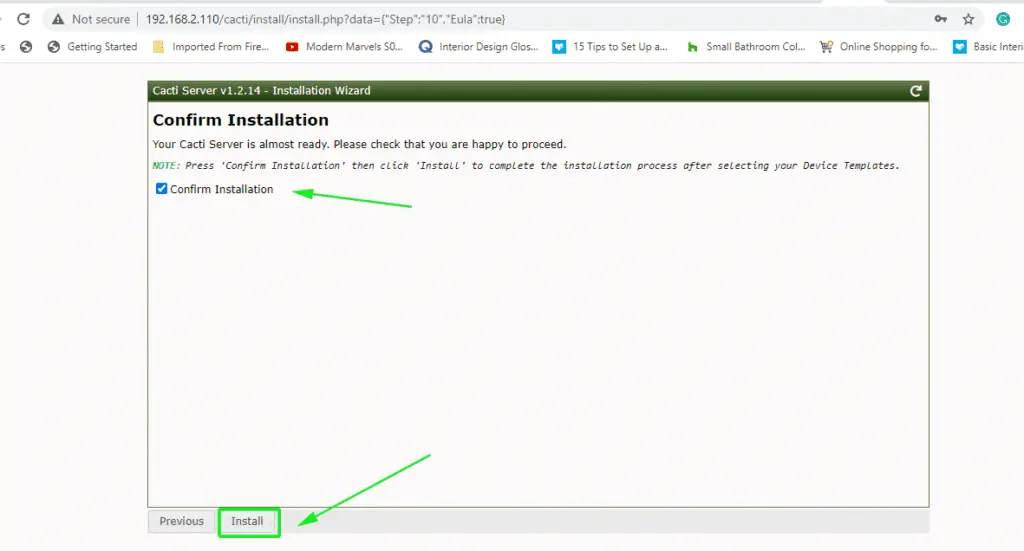
To begin the installation, click on the ‘Confirm Installation’ checkbox and click on ‘Install’.
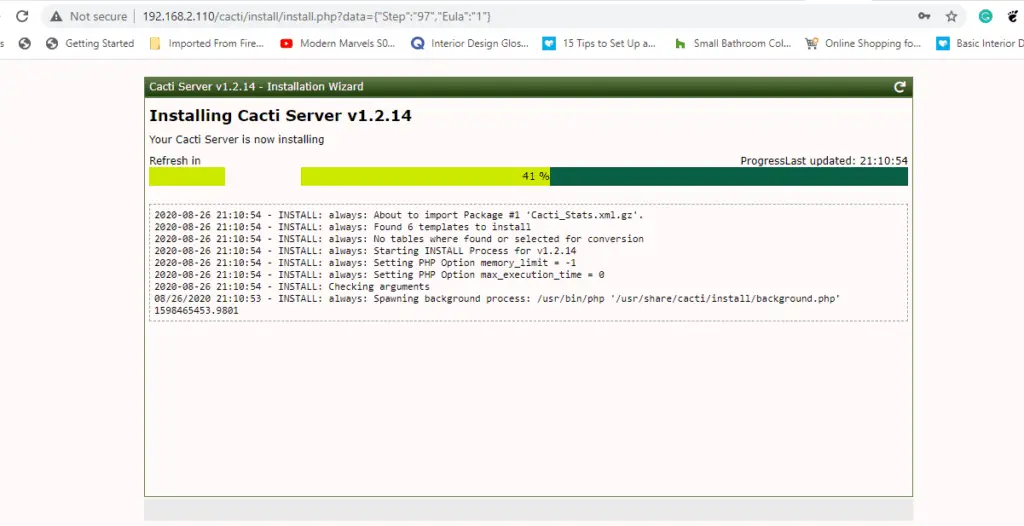
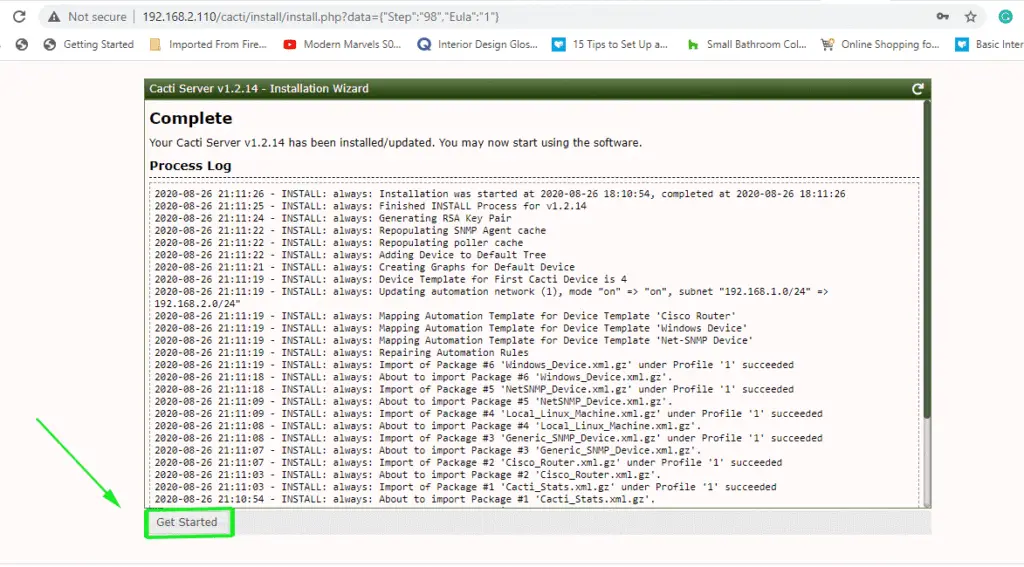
The installation of Cacti will begin and will take roughly 5 minutes. Feel free to take a break and do a bit of stretching,
Once the installation of the required packages is complete, click on the ‘Get Started’ button.
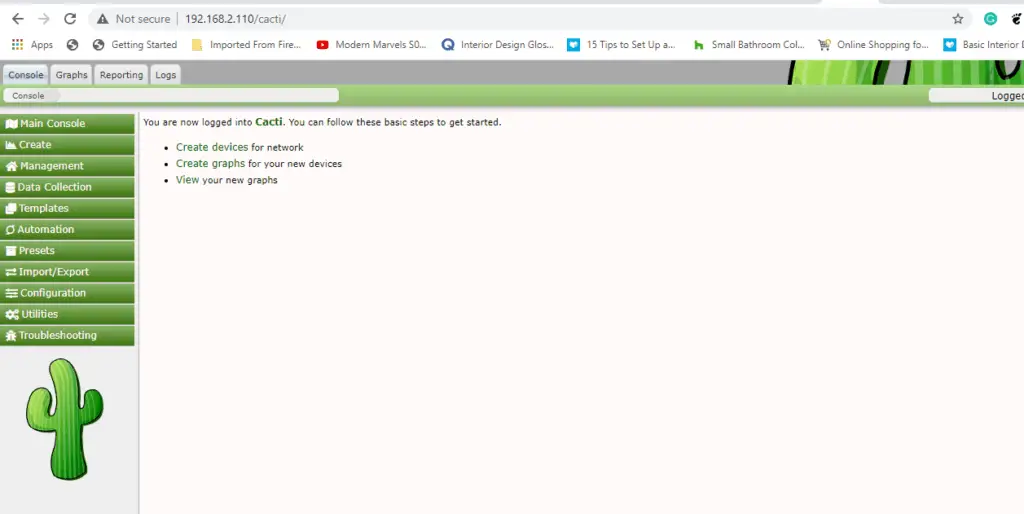
This will take you directly to the Cacti dashboard as shown.
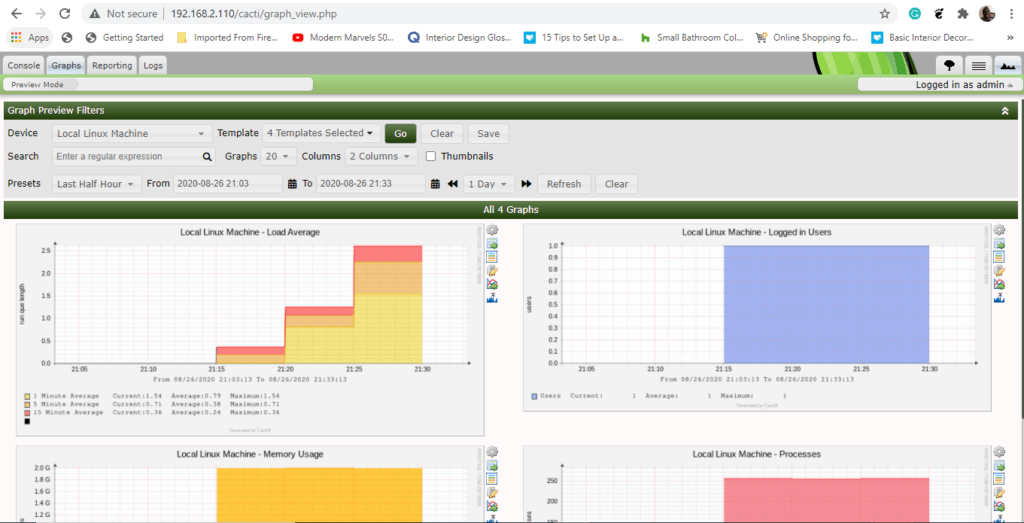
Cacti will, by default, create resource utilization graphs for your local server on which Cacti is installed. To access the graphs, navigate through:
Graph –> Default Tree –> Local –> Choose Your Device.
Wait for about 10 minutes for the graphs to be populated.
And this brings us to the end of this tutorial. Personally, I have used Cacti to monitor a range of devices and I can attest to its efficiency in monitoring several devices and sending alerts in the event of system downtime.
Read Also : How to Install Zabbix Monitoring Tool on CentOS 8/RHEL 8







Thank you James Kiarie , that was very useful
Hi,
Am having one doubt, i tried to add centos server to monitor in cacti, snmp service are started and rocommunity changed from public all done.
In cacti part in “Associated Data Queries ” the file system read by unix -get mounted partitions.
In this only three filesystem reading other filesystems are not shown.
“only xfs type reading”
In graph also the values are not matching. the values are differs. Kindly help me on this.
Hey Momin, this is what you can try:
Try removing and adding the remote CentOS server and check whether you can see the remaining file systems. We have an article on how you can add a remote host (both Ubuntu and CentOS server) on Cacti.
https://www.linuxtechi.com/add-remote-linux-host-cacti-monitoring/
Also, may I know what version of Cacti you are using? This could be a possible bug that might have been addressed in the latest version.
Hi James Kiarie,
Thank You so much for the reply.
Now i can see the disk, cpu and memory in after adding the UDP port. But there are 8 disk(file systems) but it reads only 7 disk).
/dev is not reading and its not showing. Kindly help me on this.
Hi James Kiarie,
Thank You so much for the reply.
Now i can see the disk, cpu and memory in after adding the UDP port. But there are 8 disk(file systems) but it reads only 7 disk).
/dev is not reading and its not showing. Kindly help me on this.
My cacti version is 0.8.8g