In this guide, we will cover to how to install Elastic (ELK) stack on Ubuntu 24.04 step-by-step.
ELK stack is an acronym that describes a stack of three open-source projects: Elasticsearch, Logstash, and Kibana. The stack provides visibility of the logs from your system(s), and applications, analyzes them, and creates beautiful visualizations on custom dashboards for monitoring, analytics, and troubleshooting. Let’s look at each of the elements:
Elasticsearch:
Elasticsearch is a distributed, RESTful high-performance search and analytics engine built on Apache Lucene. It’s an ideal choice for log analytics given its support for schema-free JSON documents and support for a myriad of languages.
Logstash:
Logstash is a lightweight, server-side data processing pipeline that collects data from multiple sources, transforms it, and ships it to the desired destination e.g. Elasticsearch.
Kibana:
Kibana is an open-source data web UI and data visualization tool for visualizing logs collected and processed by Logstash and Elasticsearch. It offers powerful and easy-to-use features such as histograms, line graphs, pie charts, heat maps, and built-in geospatial support.
How to Install Elastic (ELK) Stack on Ubuntu 24.04
Without any further delay, let’s deep dive into the ELK Installation steps.
1) Install Java
Since Elasticsearch is developed in Java, you must install Java as a prerequisite. Before that, ensure that your system is up to date by running the commands:
$ sudo apt update
$ sudo apt upgrade -y
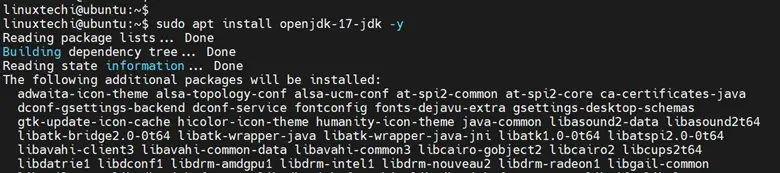
We will install OpenJDK 17, the latest stable LTS release that provides Java. To do so, install it from the standard Ubuntu repositories using the APT package manager.
$ sudo apt install openjdk-17-jdk -y
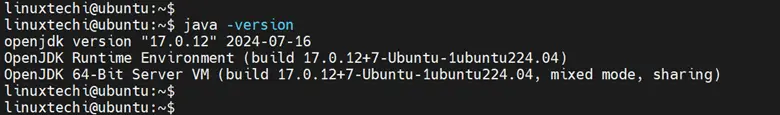
To confirm that Java is installed, run the command:
$ java -version
2) Add Elastic Stack Repository
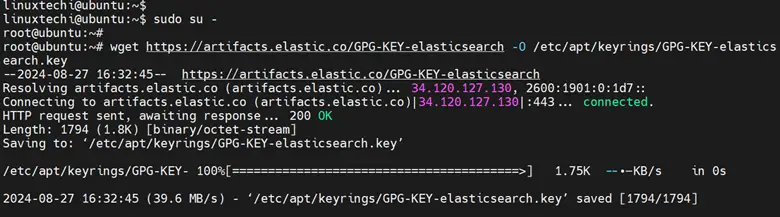
By default, all three ELK stack components are unavailable on Ubuntu’s apt repositories. Therefore, you need to manually add Elastic’s package source list. To do so, first add the GPG Key.
$ wget https://artifacts.elastic.co/GPG-KEY-elasticsearch -O /etc/apt/keyrings/GPG-KEY-elasticsearch.key
Next, add the Elasticsearch Repository:
$ echo "deb [signed-by=/etc/apt/keyrings/GPG-KEY-elasticsearch.key] https://artifacts.elastic.co/packages/8.x/apt stable main" | sudo tee /etc/apt/sources.list.d/elastic-8.x.list
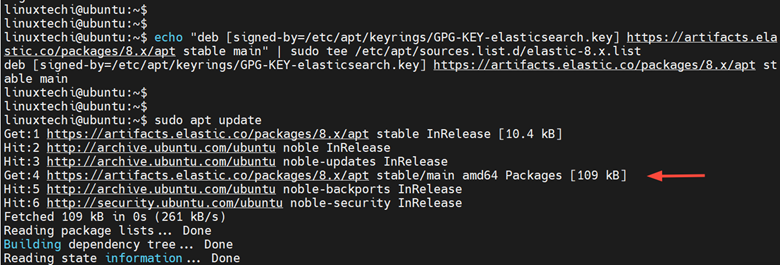
Next, refresh the local package lists to notify the system of the newly added repository.
$ sudo apt update
With the local APT cache up to date, you can now install Elasticsearch.
3) Install Elasticsearch
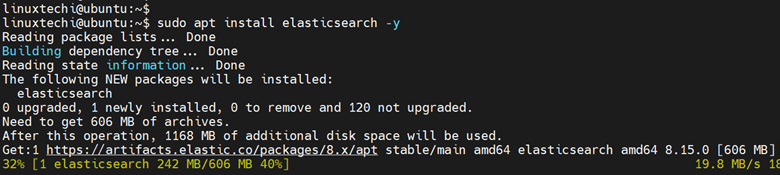
To install Elasticsearch, run the command:
$ sudo apt install elasticsearch -y
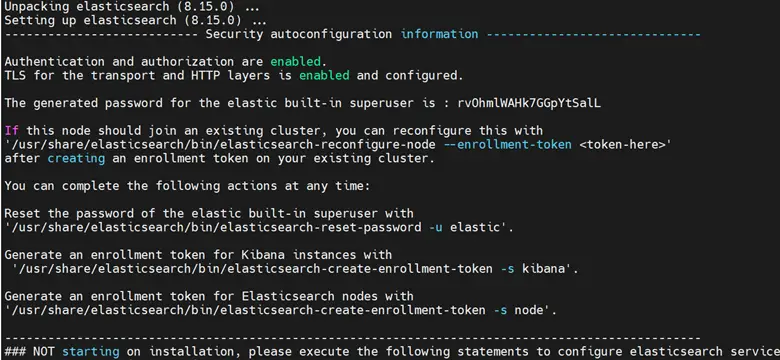
Once the installation is complete the ‘security autoconfiguration information’ will be printed on the screen.
Once the installation is complete start the Elasticsearch service by running the commands below.
$ sudo systemctl daemon-reload
$ sudo systemctl start elasticsearch
Consider also enabling the Elasticsearch service to start automatically upon installation.
$ sudo systemctl enable elasticsearch
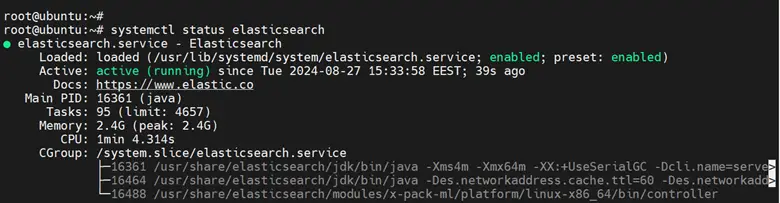
To confirm that Elasticsearch is running, execute the command:
$ sudo systemctl status elasticsearch
4) Configure Elasticsearch
Before proceeding, you need to make a few modifications to Elasticsearch. Therefore, access the Elasticsearch configuration file.
$ sudo nano /etc/elasticsearch/elasticsearch.yml
To start, be sure to give a descriptive name to your cluster by uncommenting the cluster.name directive and providing your preferred name.
Here, we name our cluster sample-cluster.
cluster.name: sample-cluster
Next, provide a descriptive name for the node by uncommenting the node.name directive.
node.name: elasticsearch-node
By default, Elasticsearch is only accessible on localhost. To make it accessible to the outside world, uncomment and update the `network.host` attribute handset it to 0.0.0.0.
network.host: 0.0.0.0
Next, locate the xpack.security.enabled: directive and set it to false.
xpack.security.enabled: false
Save the changes and exit the configuration file. To apply the changes, restart Elasticsearch
$ sudo systemctl restart elasticsearch
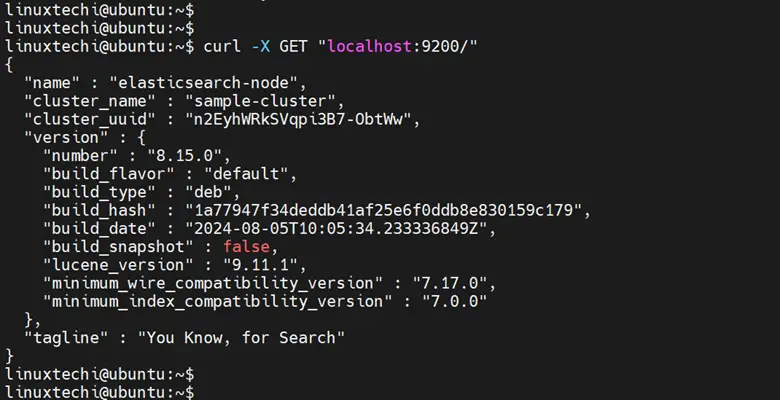
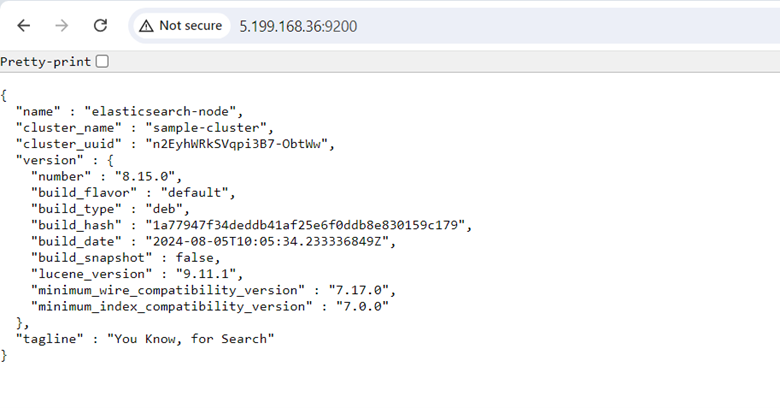
To check if your Elasticsearch service is running, send a HTTP request using the Curl utility as shown.
$ curl -X GET "localhost:9200"
You should receive a response with some basic information about your local node:
Additionally, you can do this from a web browser.
http://server_ip:9200
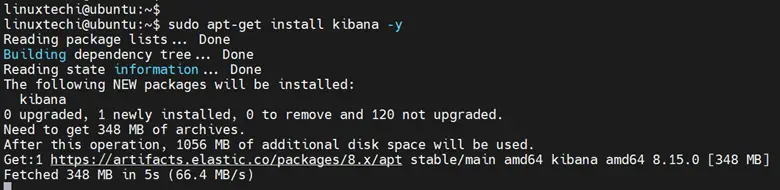
5) Install Kibana
The next component to install is Kibana. This is a powerful web-based data visualization and exploration tool for visualizing logs and time-series data. It offers powerful and feature-rich dashboards and an array of charts such as bar charts, pie charts, histograms, heatmaps, etc.
To install Kibana, run the command:
$ sudo apt install kibana -y
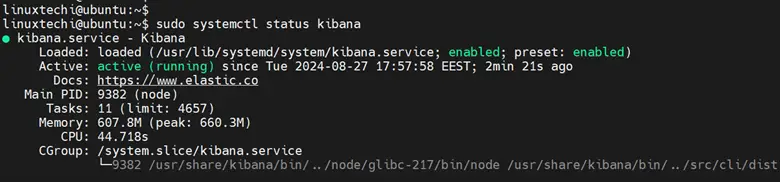
Once installed, start and enable Kibana to start automatically.
$ sudo systemctl start kibana

$ sudo systemctl enable kibana
You can check the status of Kibana by running:
$ sudo systemctl status kibana
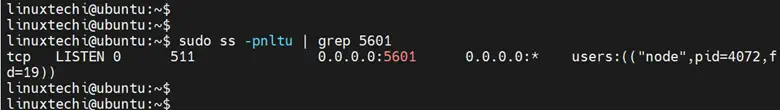
Kibana listens on TCP port 5601 by default. You can confirm this by running the command:
$ sudo ss -pnltu | grep 5601
6) Configure Kibana
Some additional tweaks are needed in Kibana for a smooth experience and to enable it to work with other components.
So, access the Kibana configuration file.
$ sudo nano /etc/kibana/kibana.yml
Uncomment the line below.
server.port: 5601
To allow connections from remote users, set server.host directive to 0.0.0.0.
server.host: 0.0.0.0
In addition, uncomment the following line
elasticsearch.hosts: ["http://localhost:9200"]
Save the changes and exit. To apply the changes made, restart Kibana.
$ sudo systemctl restart kibana
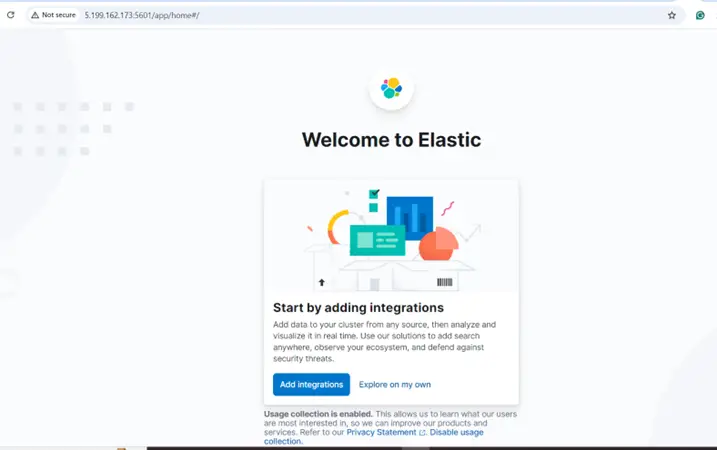
To access Kibana from your web browser, visit the following URL.
http://server-ip:5601
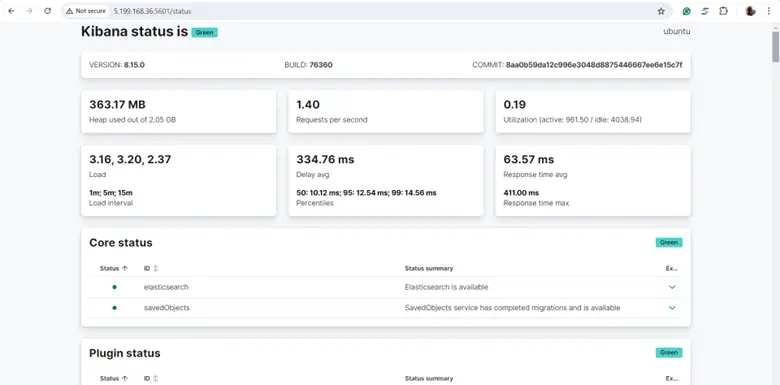
In addition, you can have an overview of its status and available services by visiting the following URL.
http://server-ip:5601/status
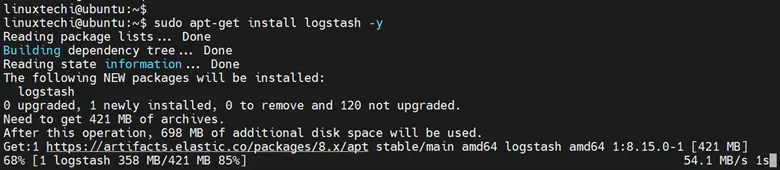
7) Install Logstash
The next component to install will be Logstash. This pipeline processes and sends data to Elasticsearch for indexing and storage. To install Logstash, run the command:
$ sudo apt install logstash -y
Once installed, start and enable Logstash by running the following commands
$ sudo systemctl start logstash
$ sudo systemctl enable logstash
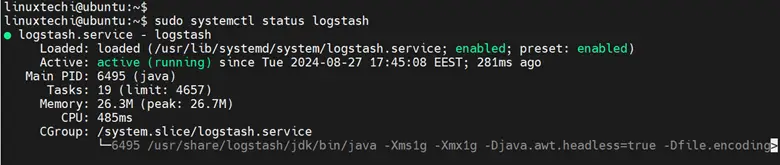
To check the log stash status, run the command:
$ sudo systemctl status logstash
8) Configure Logstash
As mentioned earlier, Logstash is a pipeline that parses and processes data and sends it to the desired destination, in this case, Elasticsearch.
A pipeline consists of two mandatory elements: input and output. The filter element is optional. The input plugin takes or ingests data from the source. The filters are intermediary plugins that process data while the output plugnis ships and writes data to a destination.
Moving on, create a configuration file called 02-beats-input.conf. This is where you will set up your Filebeat input:
$ sudo nano /etc/logstash/conf.d/02-beats-input.conf
Add the following lines of code:
input {
  beats {
    port => 5044
  }
}
Next, create a configuration file called 30-elasticsearch-output.conf:
$ sudo nano /etc/logstash/conf.d/30-elasticsearch-output.conf
The output configures Logstash to store the Beats data in Elasticsearch, running at localhost:9200. We use Beats as the index. In this tutorial, the beats will be supported by filebeat.
output {
  if [@metadata][pipeline] {
     elasticsearch {
     hosts => ["localhost:9200"]
     manage_template => false
     index => "%{[@metadata][beat]}-%{[@metadata][version]}-%{+YYYY.MM.dd}"
     pipeline => "%{[@metadata][pipeline]}"
     }
  } else {
     elasticsearch {
     hosts => ["localhost:9200"]
     manage_template => false
     index => "%{[@metadata][beat]}-%{[@metadata][version]}-%{+YYYY.MM.dd}"
     }
  }
}
Save and exit. To test the Logstash configuration, run the command:
$ sudo -u logstash /usr/share/logstash/bin/logstash --path.settings /etc/logstash -t
The output comprises a block of code lines with the string – Config Validation Result: OK. Exiting Logstash – displayed at the end. If you do not see this in your output, be sure to review your Logstash configuration for errors
To effect the changes, be sure to restart logstash
$ sudo systemctl restart logstash
9) Install and Configure Filebeat
The last component to install is Filebeat. This is one of the lightweight shippers that forwards centralized log data to either elasticsearch or Logstash depending on how it is configured.
To install Filebeat, run the command:
$ sudo apt install filebeat -y
Next, we will configure Filebeat to ship data to Logstash. so, access the Filebeat configuration file:
$ sudo nano /etc/filebeat/filebeat.yml
We will configure Filebeat to send data directly to Logstash for processing instead of Elasticsearch. Therefore, we will disable Elasticsearch output. To achieve this, locate the `output.elasticsearch` section and comment out the following lines:
...
#output.elasticsearch:
  # Array of hosts to connect to.
  #hosts: ["localhost:9200"]
…
Next, we will configure Filebeat to connect to Logstash on Elastic Stack server at port 5044. To do this, uncomment the lines `output.logstash:` and `hosts: [“localhost:5044”]`.
output.logstash:
  # The Logstash hosts
  hosts: ["localhost:5044"]
Once done, save the changes and exit.
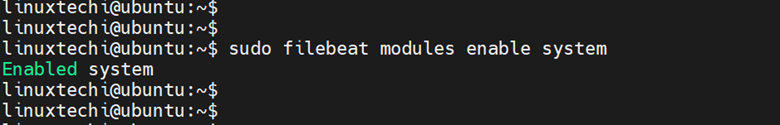
Filebeat modules extend the functionality of Filbeat. Here, we will enable the system module which collects and parses logs generated by the logging service of the system.
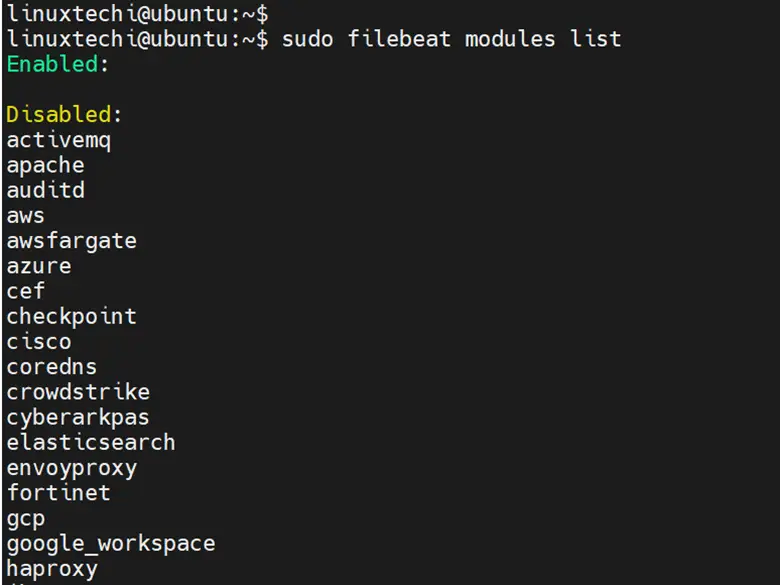
To get a list of all the available modules run the command:
$ sudo filebeat modules list
To enable the system module, run the command:
$ sudo filebeat modules enable system
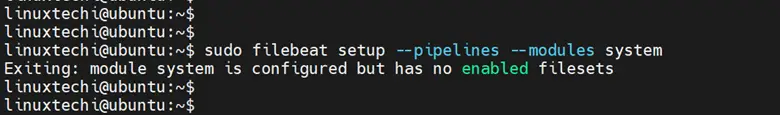
Next, you need to configure the Filebeat ingest pipelines. The pipelines parse log data before passing it through Logstash to Elasticsearch. Run the following command to load the ingest pipeline for the system module.
$ sudo filebeat setup --pipelines --modules system
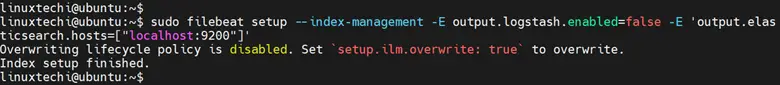
Next, you need to load the index template into Elasticsearch. An index is simply a set of documents with similar characteristics. To load the template, run the command:
$ sudo filebeat setup --index-management -E output.logstash.enabled=false -E 'output.elasticsearch.hosts=["localhost:9200"]'
By default, Filebeat provides sample Kibana dashboards for visualizing Filebeat data in Kibana. Therefore, before using the dashboards, it’s imperative to create the index pattern first and load the dashboards into Kibana.
To do so, run the command:
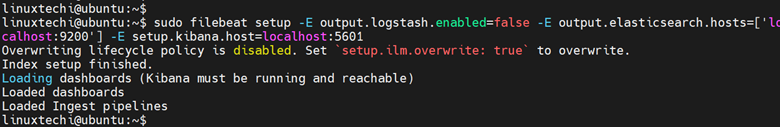
$ sudo filebeat setup -E output.logstash.enabled=false -E output.elasticsearch.hosts=['localhost:9200'] -E setup.kibana.host=localhost:5601
From here, start and enable Filebeat.
$ sudo systemctl start filebeat
$ sudo systemctl enable filebeat
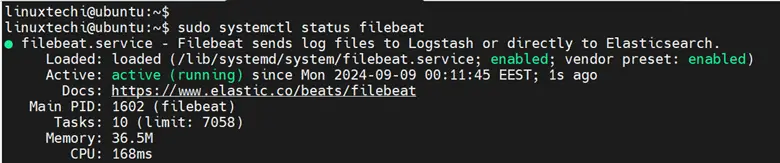
Be sure to check its status
$ sudo systemctl status filebeat
And that’s it. We have successfully configured Filebeat and it should be shipping log data to Logstash for processing and eventually to Elasticsearch for indexing.
That’s all from this guide, We have above these instructions help you to install Elastic (ELK) Stack on Ubuntu 24.04 system. Feel free to post your queries and feedback in below comments section.
Also Read: How to Install PHP 8.3 on Ubuntu 24.04 (Simple Guide)